1M entries, 0.6 seconds.
Search performance: scale vs. latency
Vertical axis is log scale. Before the fix, latency grew quadratically with scale and hit a timeout crash at 1M entries; after all three fixes, it stays sub-second regardless of scale.
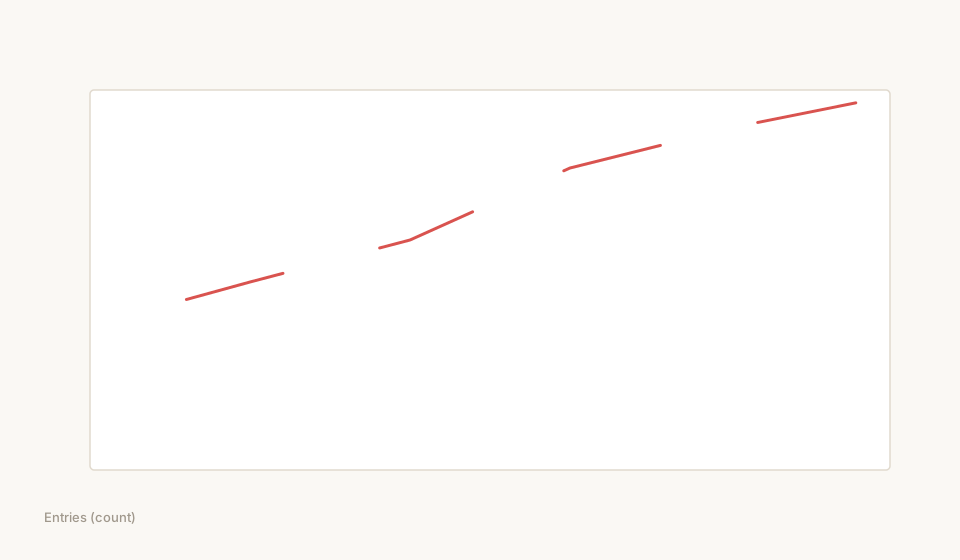
Search optimization timeline
| Stage | Search latency (1M entries) |
|---|---|
| Unfixed (O(n²) reverse lookup) | >60s timeout (search crash) |
| After Top-K heap sort fix | 50~94s |
| All three fixes (warm search) | 0.59~0.61s |
| All three fixes (cold start) | 28~35s (cache build, once) |
1M entries, resource usage
| Item | Value |
|---|---|
| Memory RSS | 5.3GB (safe on a 16GB machine, ~1/3) |
| Index file | 1.0GB / 1.01M terms |
| Warehouse text (json) | 1.9GB |
| Warm search latency | 0.59~0.61s |
| Cold start latency | 28~35s (cache build, once) |
The three fixes
Fix 1: Reverse-lookup cache (O(n²) → O(1))
Search re-read the whole warehouse + linear scan to find ids per hit, forming O(n²). Added an mtime-invalidated in-memory cache (id → entry hash table), dropping reverse lookup from O(n) to O(1). Search over 30k entries went from 10.9s to 0.84s.
Fix 2: Top-K heap sort (O(n log n) → O(n log k))
Search was fully sorting all hits just to take the top 20. Switched to a max-heap maintaining only top-20, eliminating the sort cost.
Fix 3: Index cache + rare-word-first (50~94s → 0.6s)
High-frequency words (like "memory") hit 1M entries and the full traversal scoring killed performance. Changed to: index gets an mtime cache so the 1GB isn't re-read each time; query words are ordered by hit count ascending, using only rare words (hit ≤5000) to build the candidate set. For a query like "memory base positioning," the words "base" and "positioning" each hit only ~2000 entries, collapsing traversal from 1M to ~2000.
Reproducible
- 1M warm search, 5 reruns, 0.568~0.603s, stable.
- Isolated load testing in a separate instance (
HIVE_DATA_DIRisolation), never touching the production library. - A traceable anchor embedded every 500 entries to verify recall.